 Jen HoldenLicense ID: 639966
- +1(443) 803-7620 jen@thejenholdengroup.com
November 2025 Anne Arundel County Market Report: What the Numbers Really Mean
November 2025 Market Report: What the Numbers Really Mean
If you are planning a move in Anne Arundel County, this is the detailed, data-driven read. We are breaking down pricing, inventory, buyer activity, and how long homes are taking to sell across the price points that matter most.
- Market at a Glance (the headline stats)
- Pricing Deep Dive (overall + by home type)
- Supply and Demand (inventory, listings, pending, closings)
- New Contract Activity (where buyers wrote offers)
- How Fast Homes Sold (median days on market)
- New Listings by Price Range (where new supply appeared)
- What This Means for Buyers and Sellers
- Want the neighborhood-level breakdown?
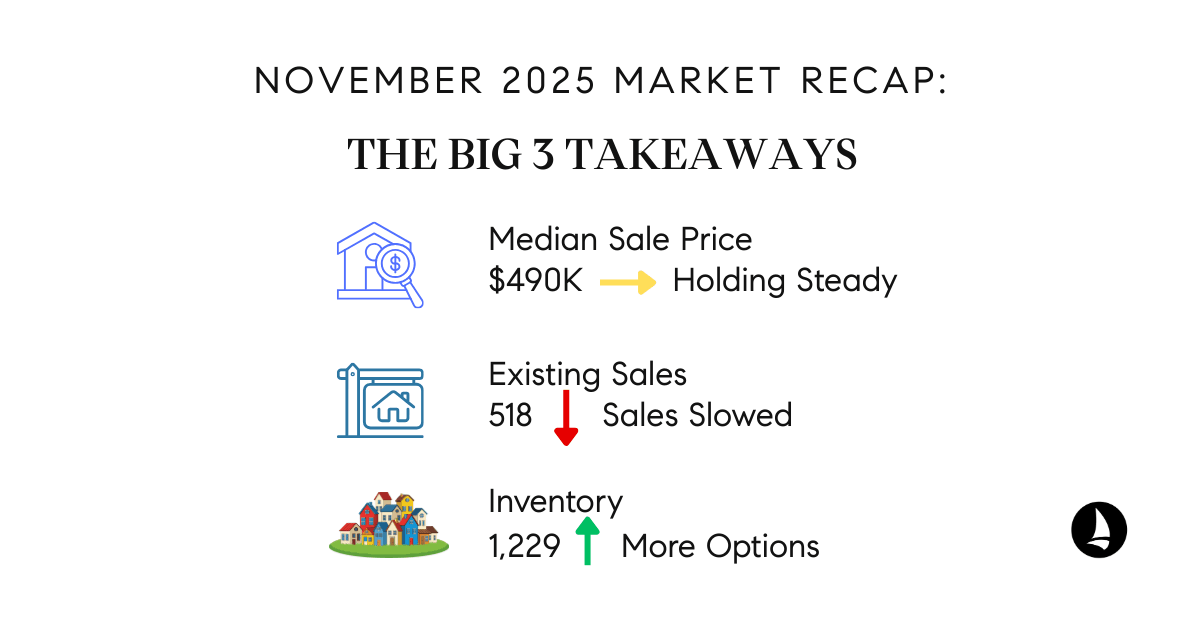
Market at a Glance
November’s story is best described as steadier pricing with more inventory. Closings were lower than last year, and the market is giving buyers and sellers a bit more breathing room, especially compared to the peak intensity we have seen in prior years.
Pricing Deep Dive: What Homes Sold For
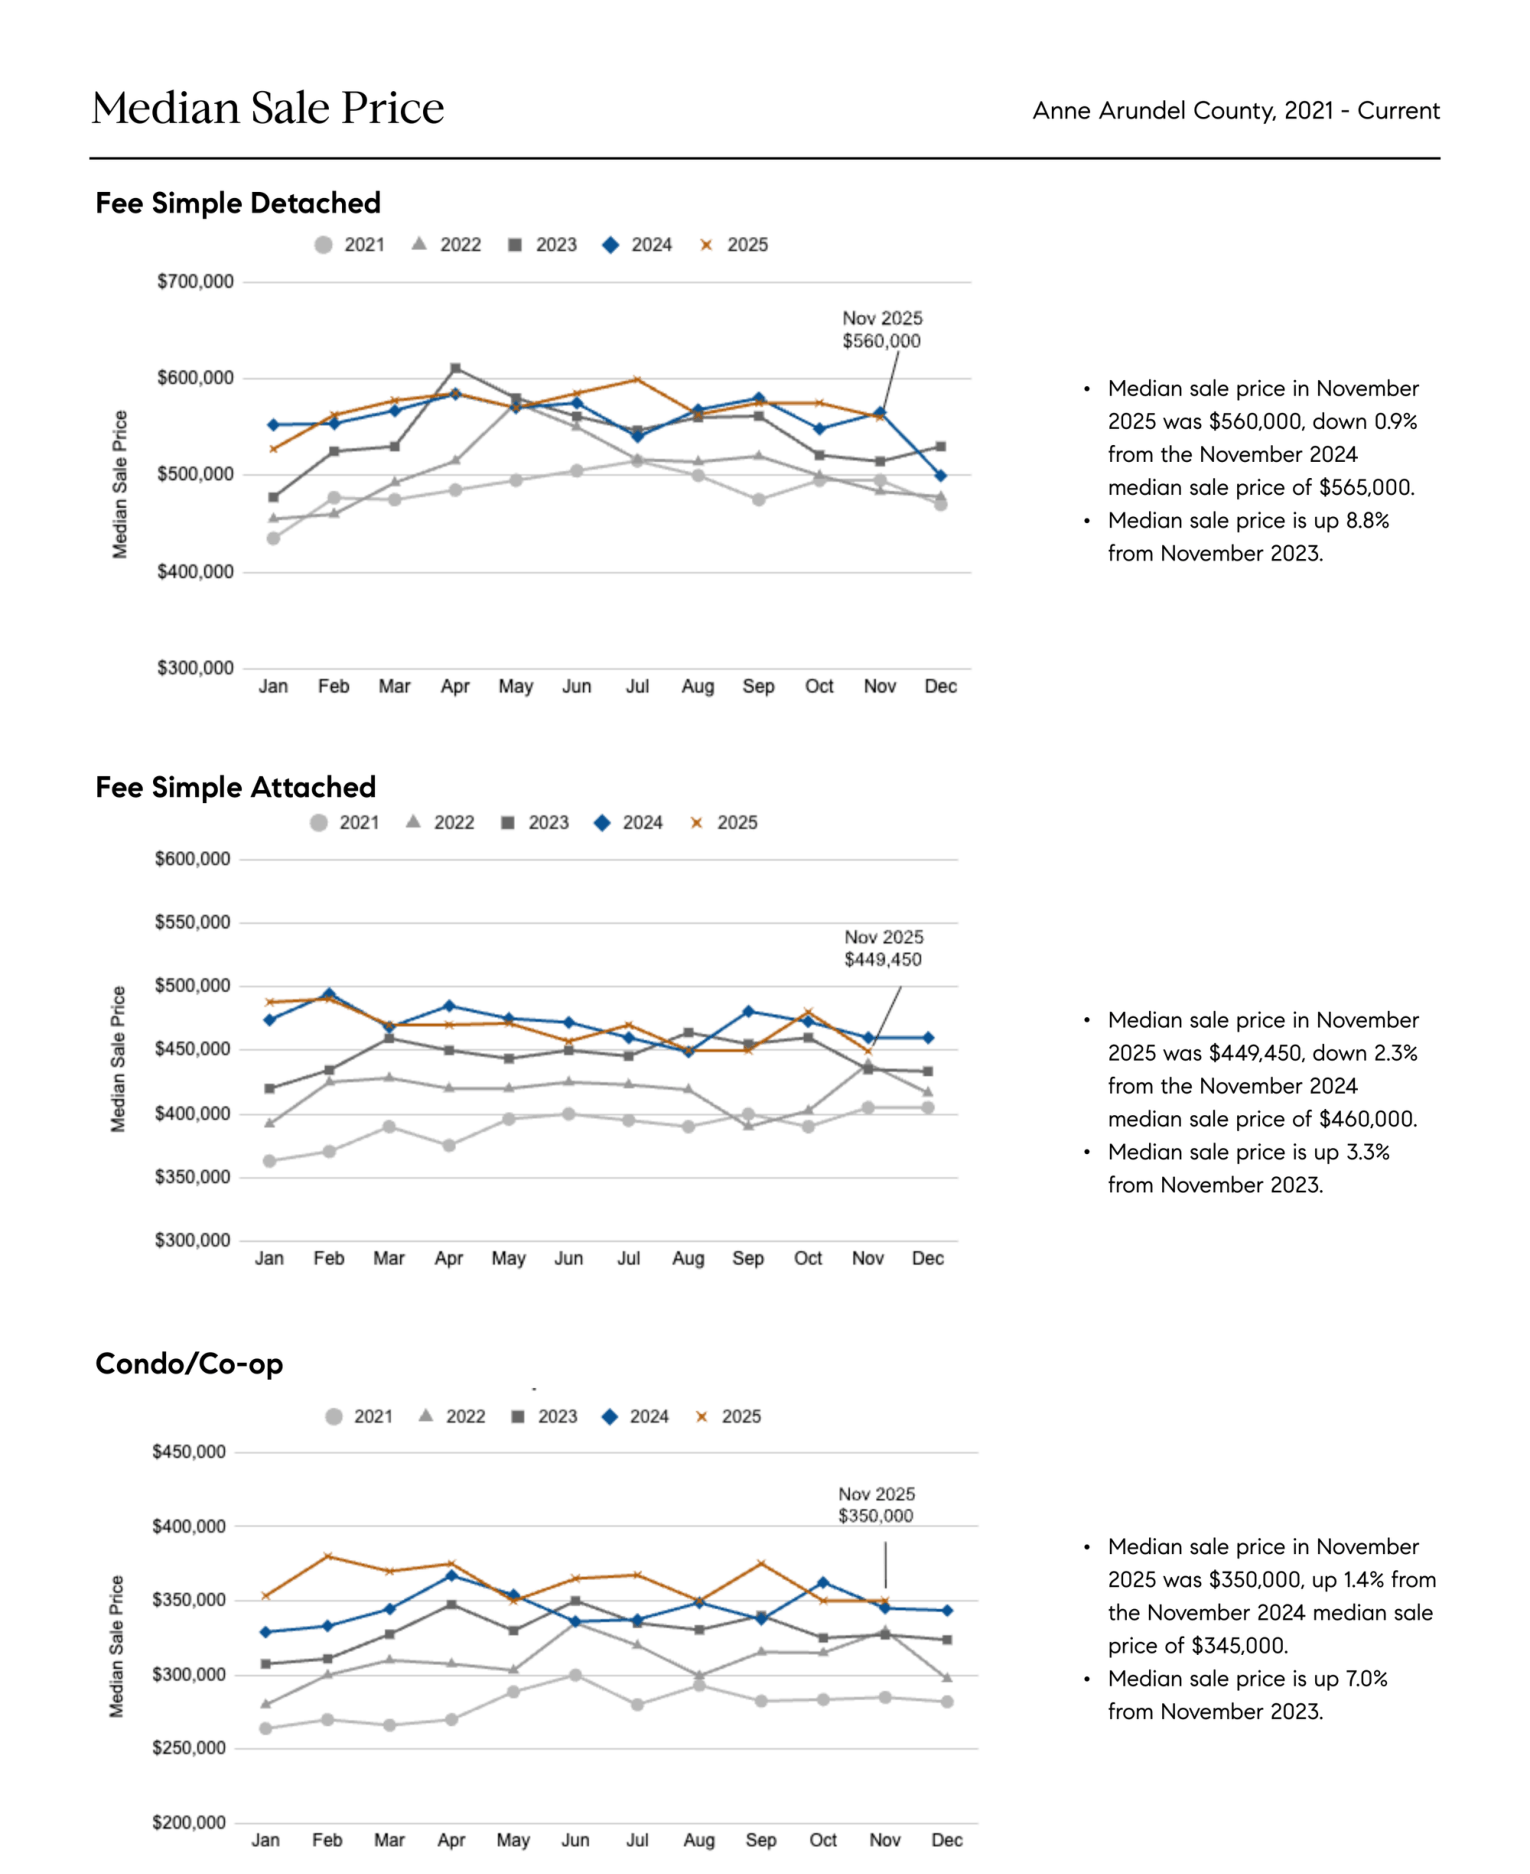
The overall median sale price for Anne Arundel County in November 2025 was $490,000, essentially flat compared to last November. Under the hood, pricing varies by home type.
vs Nov 2023: +8.8%
vs Nov 2023: +3.3%
vs Nov 2023: +7.0%
One quick interpretation: detached and townhome pricing cooled slightly year over year, while condos gained. That often shows up when buyers become more selective and value-focused.
Median price comparison (visual)
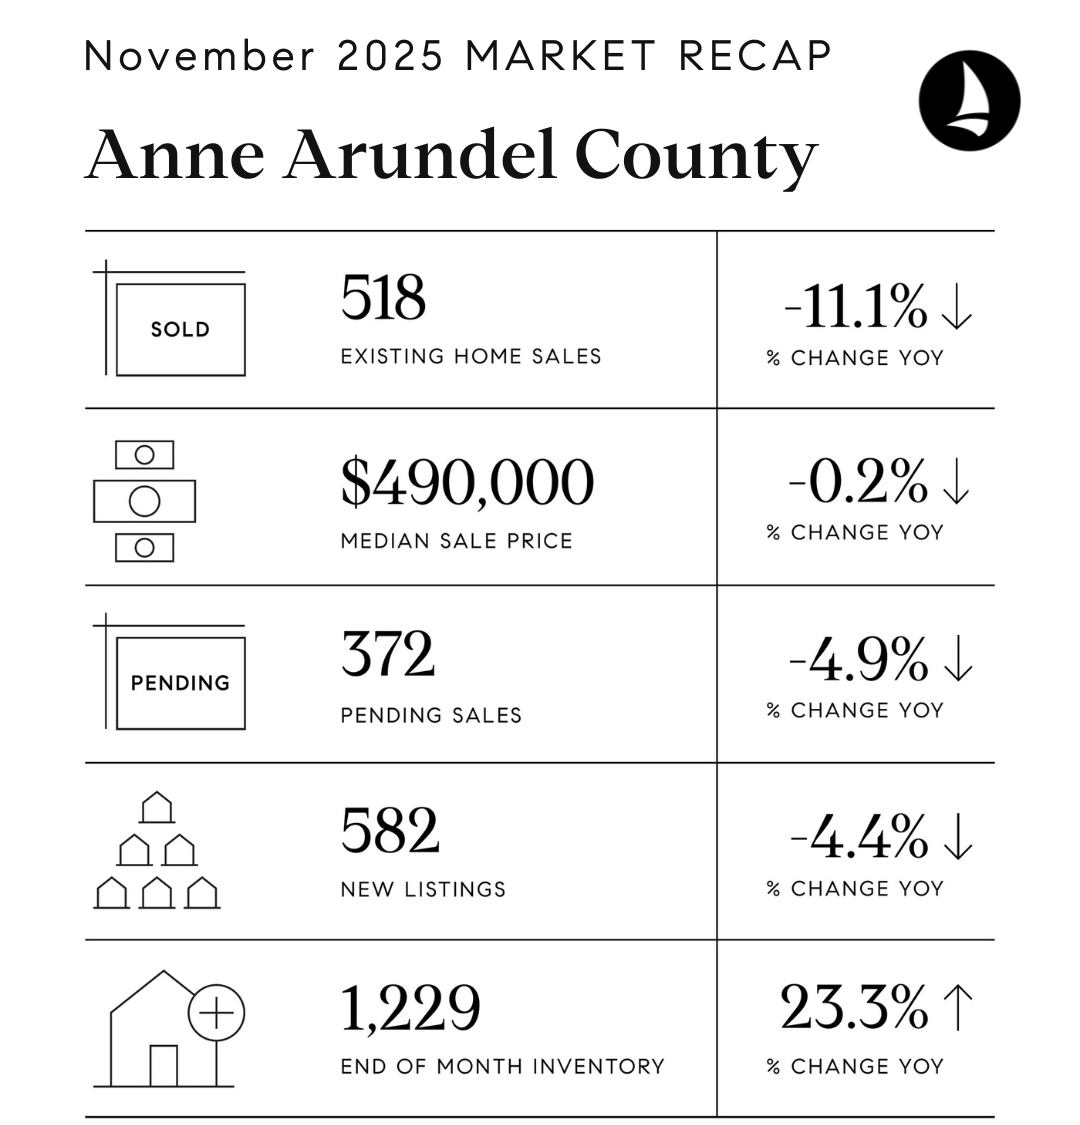
Supply and Demand: Inventory, Listings, Pending, Closings
The market balance conversation starts with one number: inventory. November ended with 1,229 homes for sale, up 23.3% year over year. That increase in available homes is meaningful. It typically translates to more choices and a bit more leverage for buyers.
Four signals to watch
- New listings: 582 (down 4.4% YoY). Fewer new listings entered the market compared to last year.
- Pending sales: 372 (down 4.9% YoY). Slightly fewer homes were under contract compared to last year.
- Closed sales: 518 (down 11.1% YoY). Closings were notably lower year over year.
- Median sale price: $490,000 (down 0.2% YoY). Values held steady overall.
Practical takeaway: more inventory does not automatically mean prices fall. In November, pricing stayed stable, but buyers gained breathing room because there were more options on the shelf.
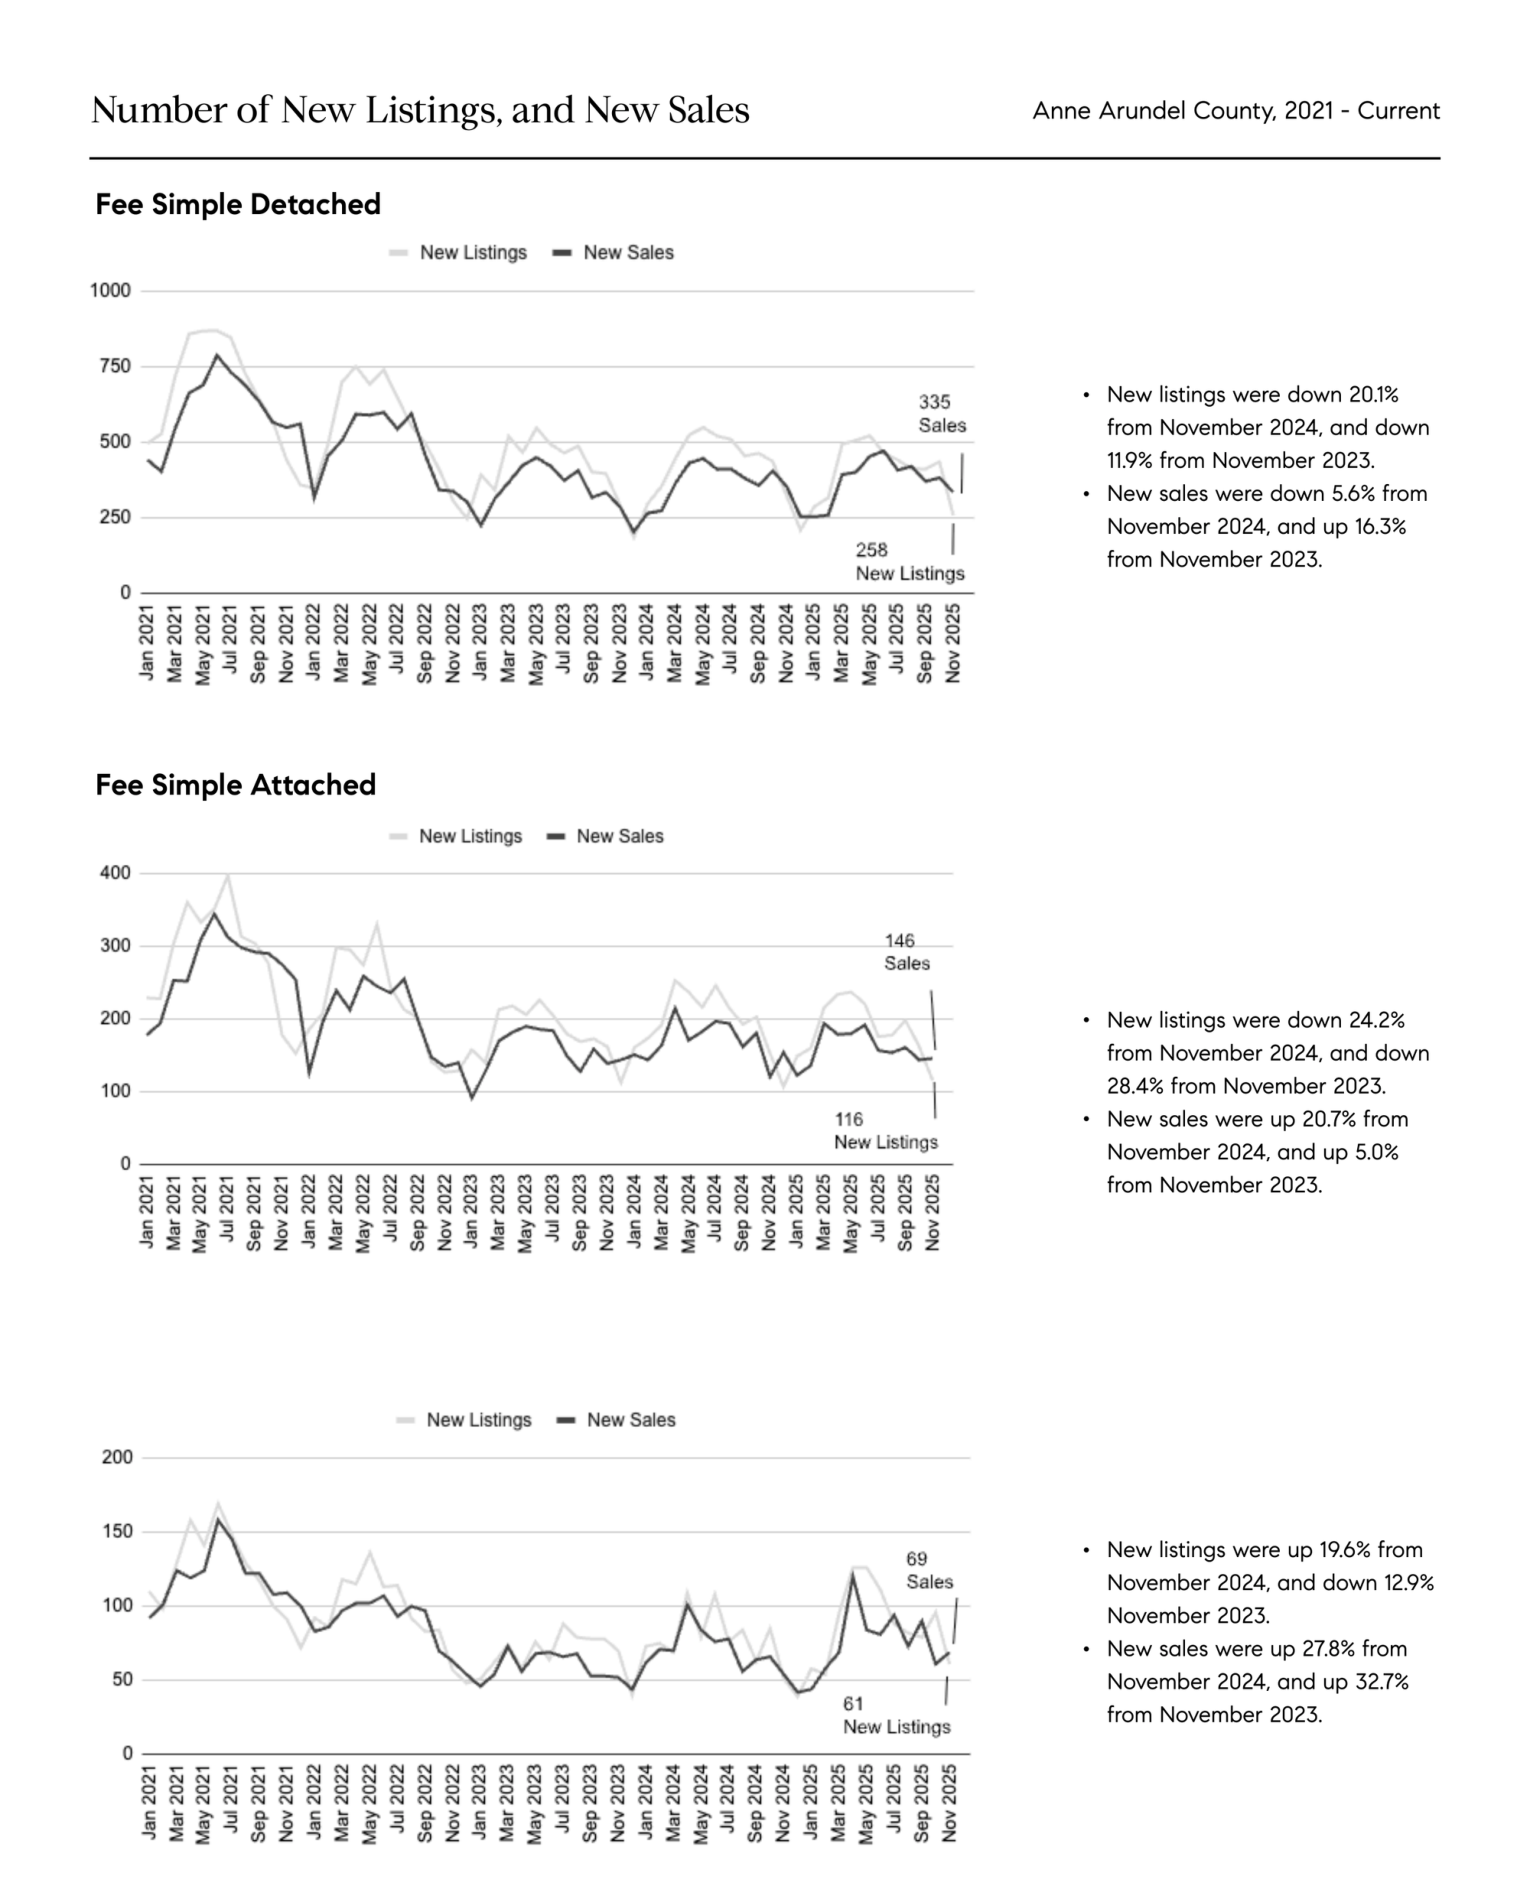
New Contract Activity: Where Buyers Actually Wrote Offers
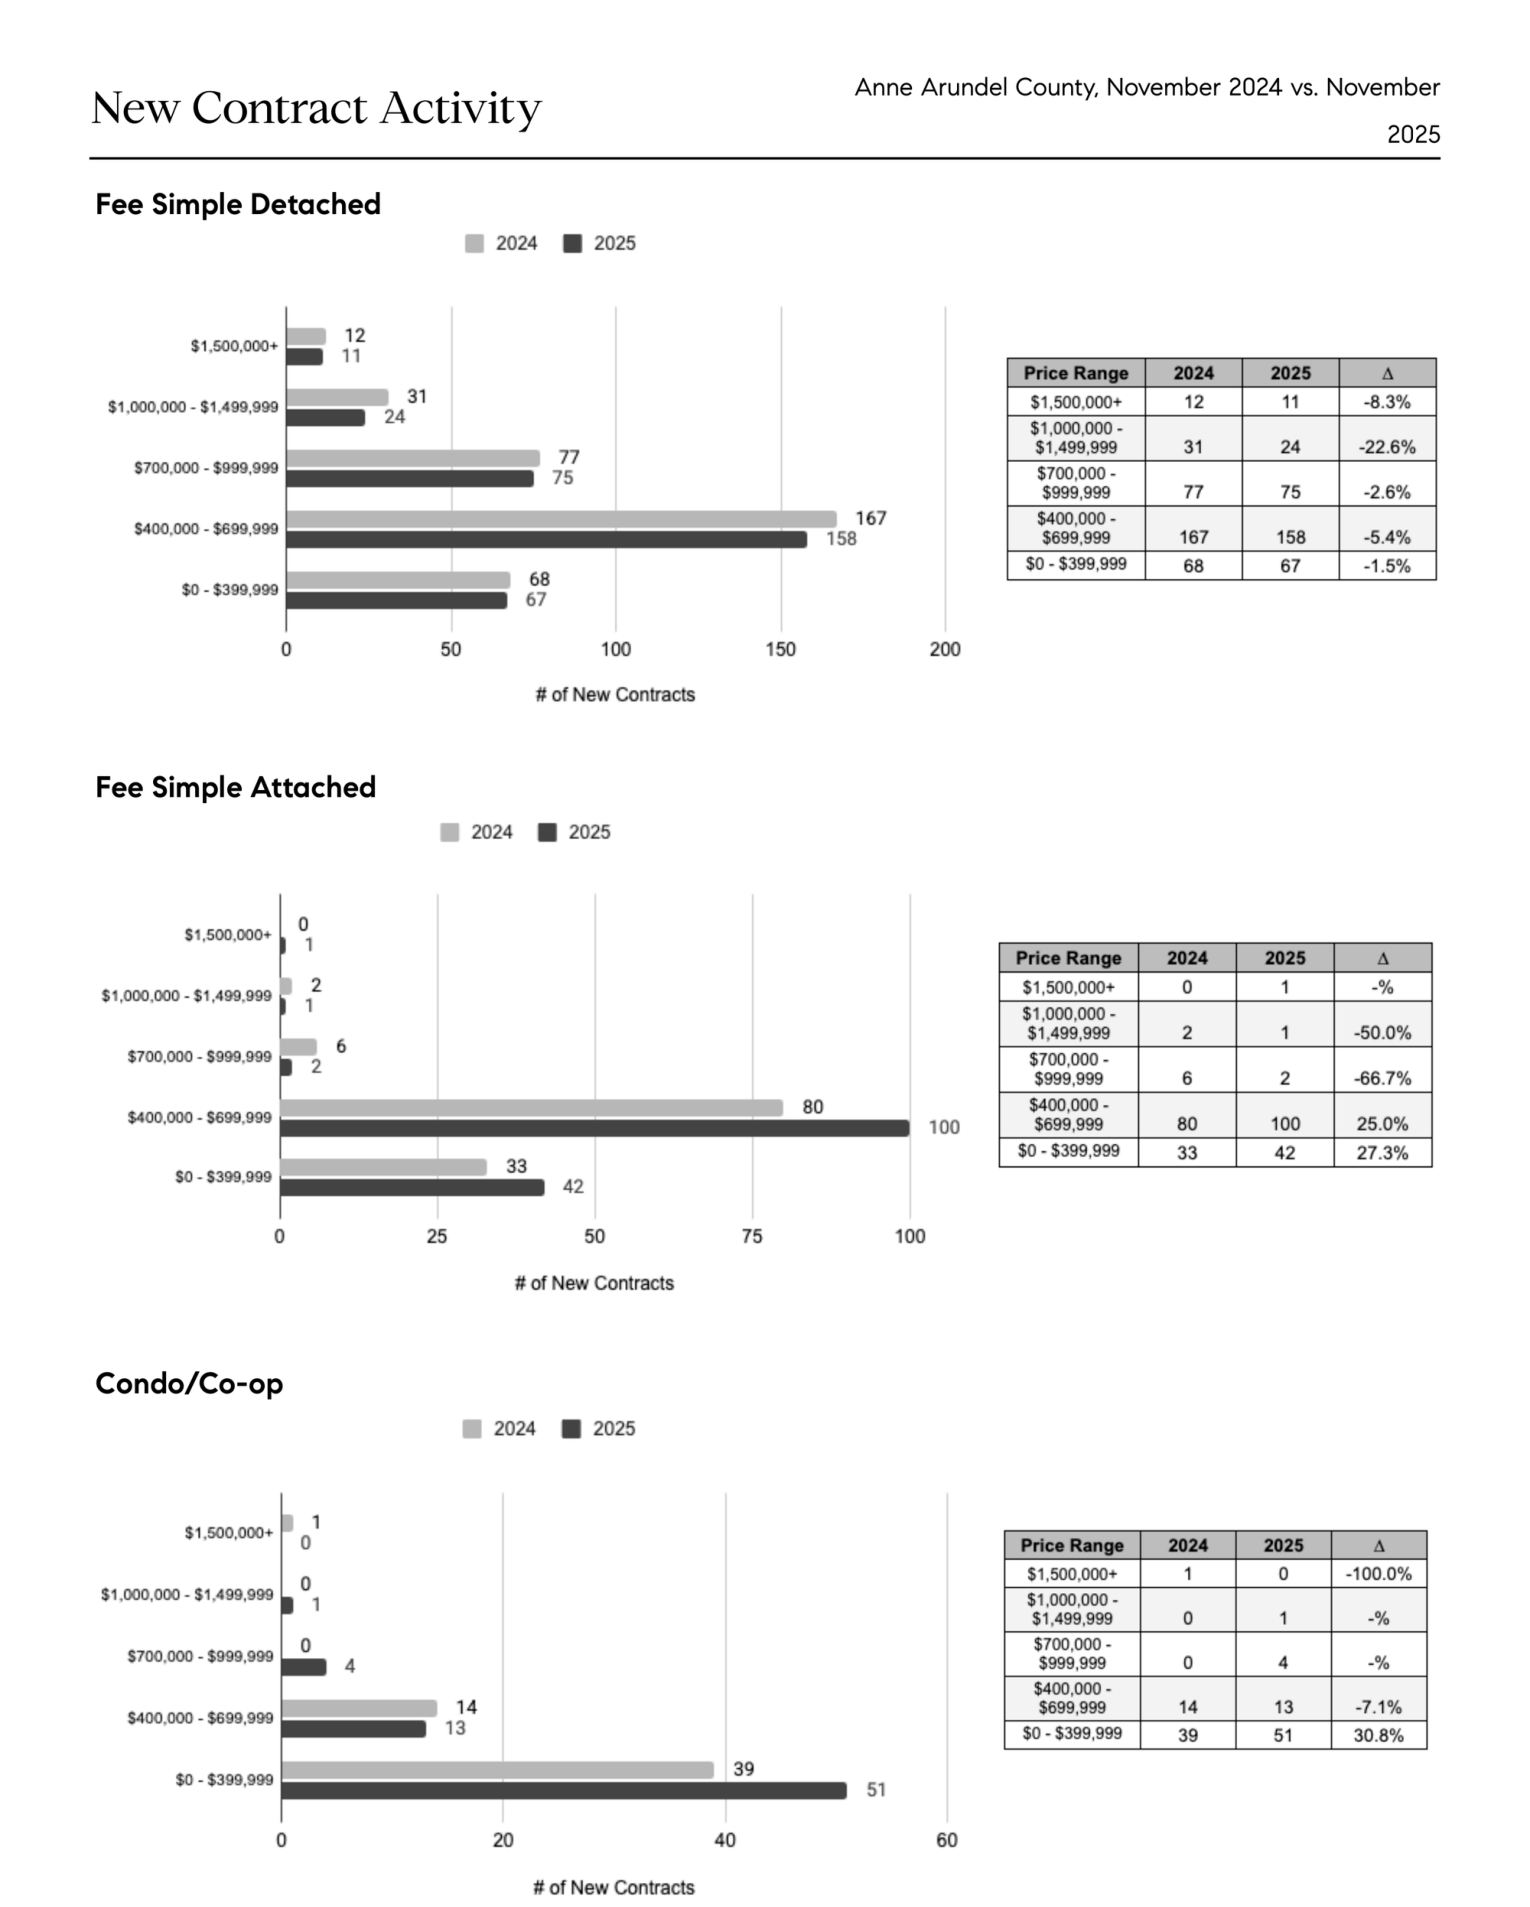
This section is one of the most useful for serious buyers and sellers because it shows where demand is strongest by price band. Think of it as: where buyers voted with their offers.
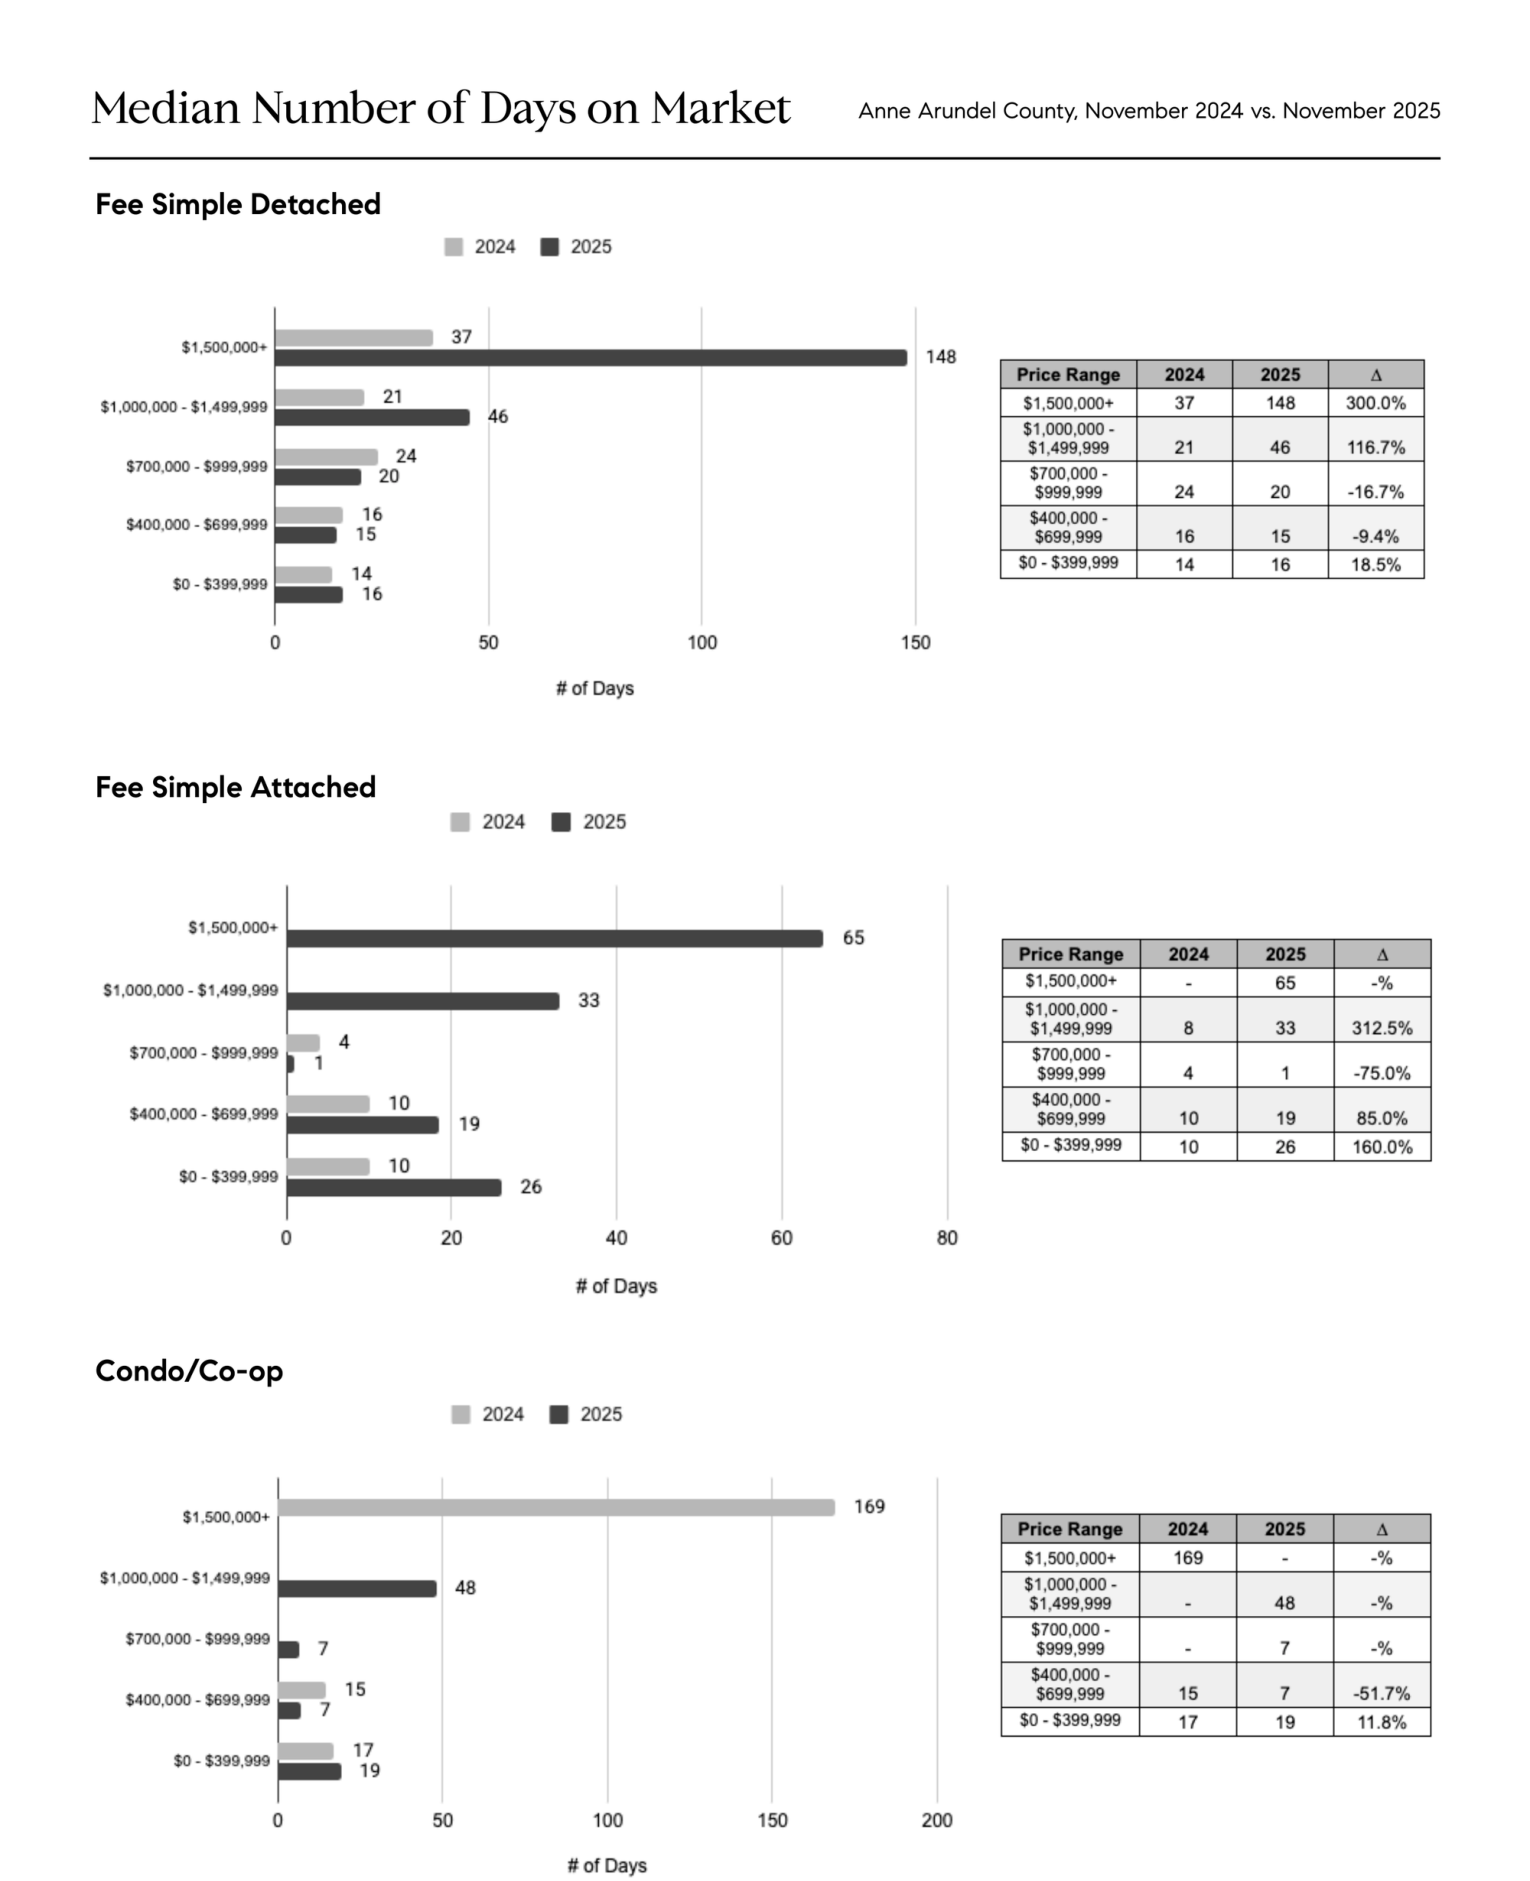
How Fast Homes Sold: Median Days on Market
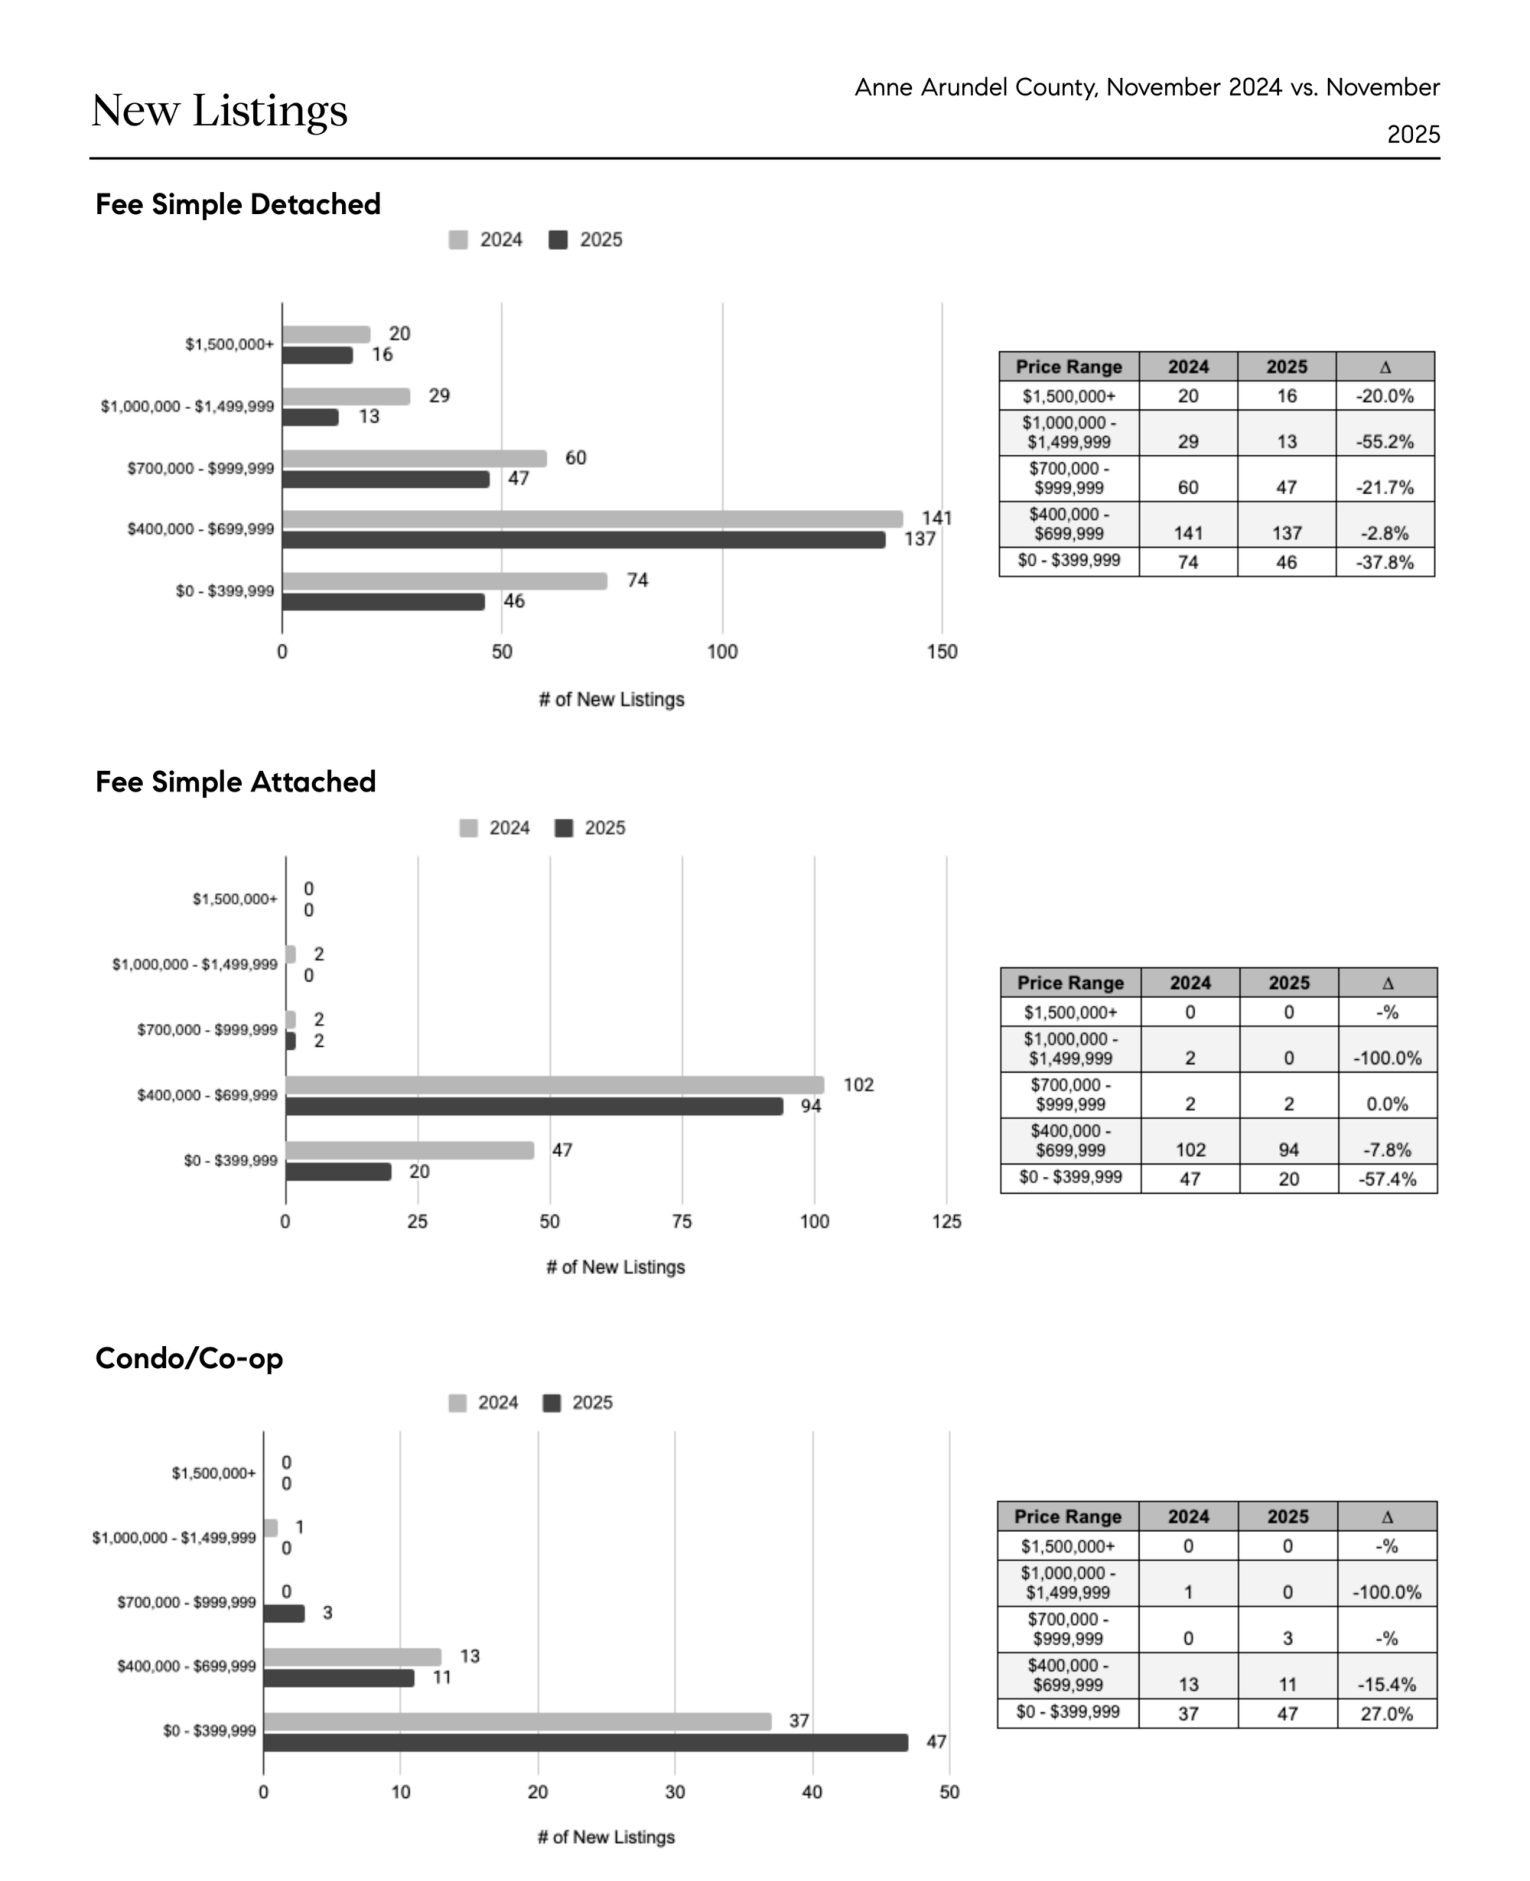
New Listings by Price Range: Where Fresh Inventory Appeared
What This Means for Buyers and Sellers
Want the neighborhood-level breakdown?
If you tell us your neighborhood (or two) and your price band, we will pull a tailored snapshot including current competition, recent comps, and what is realistically working right now.
Disclaimer: This content is for informational purposes only. Data is based on Bright MLS market statistics and is deemed reliable, but it is not guaranteed. Figures may be subject to errors, omissions, and changes. This is not financial or legal advice. Compass is a licensed real estate brokerage and supports Equal Housing Opportunity.
Categories
Recent Posts